Have you ever noticed that late projects only ever seem to get later?
Why is it that any gains get absorbed and delays get compounded?

Let’s say I have a mini-project where I have a builder adding a kitchen to a house, he will construct the walls and then I’ll have a plumber come in to install the pipes and fittings. The builder estimates 4 days and the plumber 4 days.
If the builder is done sooner, say after 2 days, that gain is lost as the plumber was expecting 4 days so is not available until the originally planned date. If however the builder takes longer - say 6 days then this impacts on the plumber and at best delays him by 2 days, but more likely he has other commitments so it may result in delays beyond the 2 days ‘lost’ by the builder if he has to reschedule.
The only way to avoid this is for the plumber to build in slack before and after the planned job which is not practical unless he significantly inflates his fees to enable that level of flexibility.
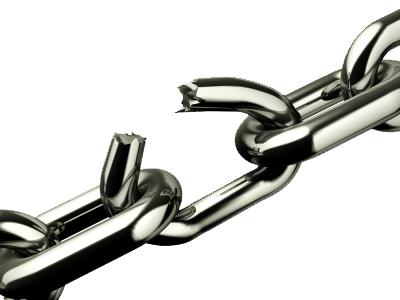
That is a very simple example of a single dependency between two variable events. The majority of systems have chains of dependencies, each compounding this problem for every additional link in the chain.
Just think about your Doctor, they make appointments every 15 minutes throughout the day, if the average appointment lasts 15 minutes then it is likely by the end of the day as any appointment that runs over will delay the next appointment but any time they get ahead the patient hasn’t arrived yet. By the end of the day they may be running a long way behind and relying on your slack time to ensure you get seen. These are just a couple of examples of the Theory of Constraints in action.
Team Activity/Experiment
I’d like to share an activity I have been using in training classes to help people understand the impact of variability, constraints and dependencies on a system - including and especially software delivery. The principles are not limited to software or manufacturing but apply to any system where you are dependent on someone or something. It also shows how improvements in the wrong area do nothing to help your team.
I find learning is best cemented when you can take a group and have them look at a problem in a particular way so that they discover the solution and form their own understanding. No matter how respected the teacher offering solutions is they will never have the same impact as when you discover the answer for yourself. This is why I love teaching in a way that involves experiments.
The Experiment
The activity is best played in groups of 4, this gives everyone a role (and a roll of the dice) and enough opinions to have a debate about the implications.
Each team starts with 4 workstations or 4 stages in a workflow.
Each team starts with a backlog of work (a pile of blocks) and each block must flow through each workstation.
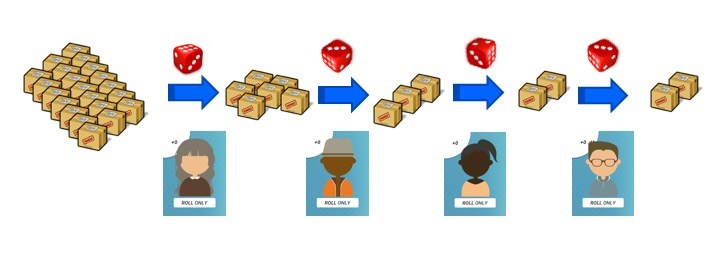
In any given iteration, each person in the workflow has the same potential output/productivity and is represented with the roll of a dice. The dice roll simulates a perfectly balanced system and allows for the variability of work: some tasks are easier or harder than others and some days we are more productive than others, but in this simulation we are all - on average - equally capable, we are perfectly balanced.
We run for 10 iterations. Each iteration is started with the first person will perform their work by rolling the dice, moving blocks, and passing the dice on to the next person. Any unmoved blocks remain in progress until the next round, and so on until each person has completed the work for that iteration. Each person in theory is capable of producing an average of 3.5 units of work and after 10 iterations the system at worst case will produce 10 units at best it will have produced 60.
Over 10 iterations, each workstation has an average capability of 35 units, all workstations have identical potential capability. If everyone worked at average productivity the system should be capable of producing 35 units of work.
Planning based on potential capability
This is very similar to the planning process in Scrum where planning is based on estimated times for all tasks. With planning based on the sum of the duration of all tasks being equal to the amount of time available in the sprint. E.g. 10 days worth of team effort in a 10 day sprint.
In the game, we ask the teams to predict the system output, and challenge any team that predicts a system output of less than 35 to justify why they are expecting their workers to be working at below their average potential.
This can be an interesting debate. Some suggest that people are not as variable as dice, or that stories are not as variable, but this usually results in debate and finally agreement that in fact people are MORE variable: tired, hungry, sick, bad day, good day, vacation, level of experience or familiarity with the job at hand etc. all result in huge variation in the person’s output on any given day. Stories can be split to be a smaller size to reduce variation in theory, but the complexity varies. Some need input from 3rd parties, some will go smoothly while others will hit issues, some take longer depending on who is working on it and so on. We take steps to reduce variation but we cannot eliminate it completely. We rarely know everything, so there will always be some surprises.
This conversation is crucial to understanding the the problem that most of us routinely overlook or choose to ignore despite the massive impact on throughput. We allow this conversation to flow to help people understand the fundamental variability in any system.
By the end of the conversation normally there is consensus that variability is the normal situation and a dice roll is an adequate metaphor, albeit real life is far more volatile.
First Iteration
In the first iteration, the teams will be set up so that each player rolls the dice and passes the appropriate number of blocks to the next player, and then that player rolls and passes, and so on until all players have ‘worked’ for that iteration(cycle).
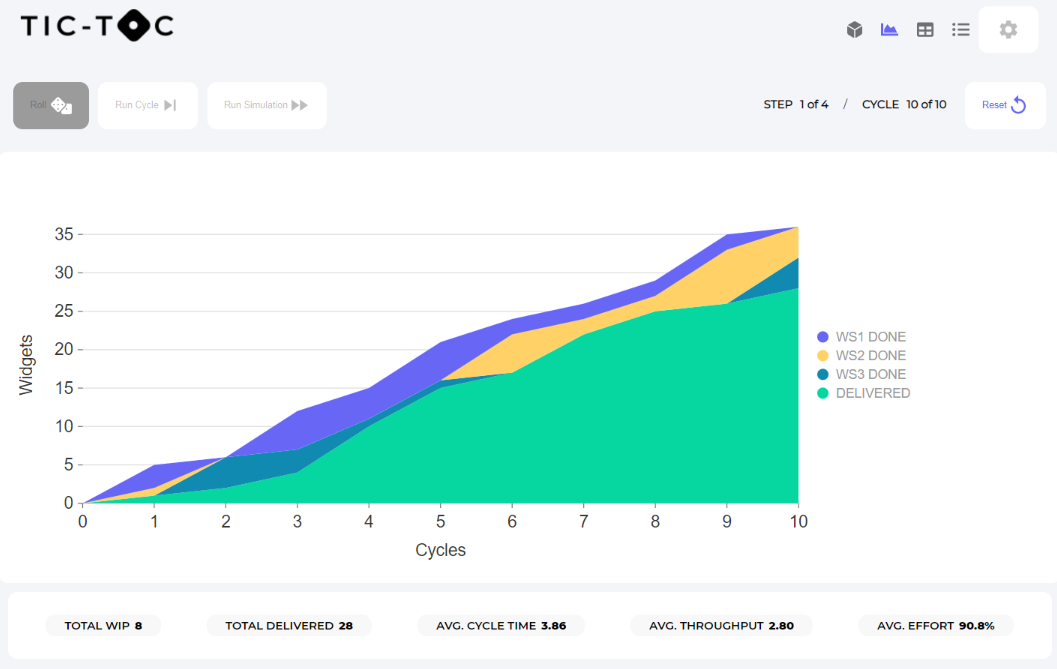
We then repeat for 9 further iterations(cycles) and observe the outcome.
You can run this experiment for yourself and play along here: Tic Toc Game
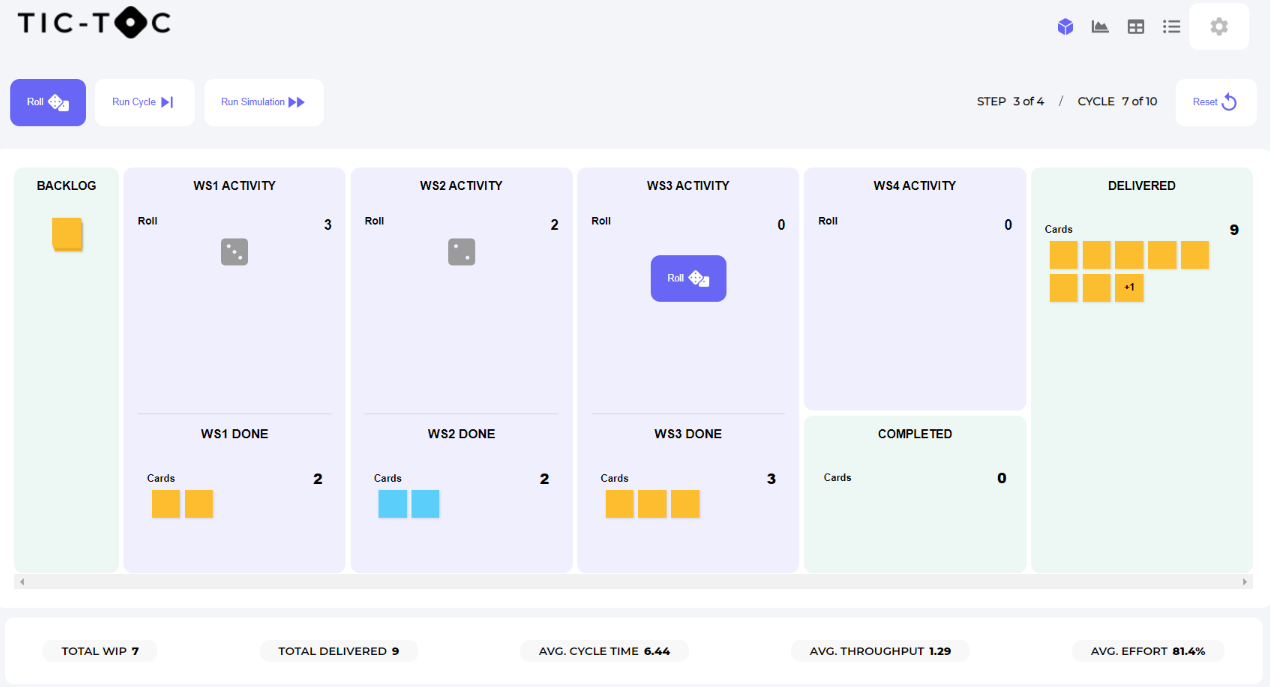
In general, the result will be an average output of around two-thirds or a little more of what would be expected - e.g. around 23-27 out of an expected 35. Sometimes more, sometimes less, as you would expect when introducing variability but the average for the room is typically in the ~25 range.
We ask the teams to explain why they are running at 70% efficiency and what is going wrong. This usually results in one person being identified as being unlucky or consistently rolling low numbers, but generally there is some understanding that there is a reason for it.
At this point you can dive deeper but usually there is sufficient belief that luck is a factor so you may need them to play again for some to accept that it is not luck.
Conclusion
By running the experiment a few times people generally begin to realise that the nature of variability and dependency have a pretty significant impact on one another and that creating a balanced system is actually pretty futile. We can improve the situation by reducing the dependencies, cross training people or giving them more autonomy - one of the principles of agile is to have a team with everyone needed to get the job done - this is because of this situation. Dependencies have far more impact on productivity than most people are willing to accept. The other factor is variability, whilst there is no way to remove variability completely, we can strive for smaller stories. This is one way of limiting variability. When it comes to humans it is even harder to remove variability, but if we strive for a sustainable pace and a good working environment, this reduces variability even if it doesn’t remove it entirely.
Second Iteration
This experiment shows what will happen with a perfectly balanced system, but what is the impact when you have an unbalanced system or add WiP (Work in Progress) limits to a system? And have you ever wondered what the financial cost of big deployments was, we can experiment to see the how much it costs to have daily deliveries compared to monthly or quarterly deliveries.
In the next iteration we can explore the impact of an unbalanced system, where your system has a bottleneck and how you can deal with it.

John Yorke, you are the first person I read that puts foundations to see why
* a pull flow and
* balancing work tasks
are key to reduce variation. Probably you know these terms but for the readers, explore the words muri, mura and muda in internet, if no relation with productivity appears, then rewrite the same and add Toyota Production System.
LikeLiked by 1 person
Hi John,
I remember doing this experiment when you came to coach our agency in the practices of Agile. Since then, we’ve had some new members come aboard and I’d like to use this experiment, but had a few questions. Would you be able to answer those for me?
LikeLike
I’d be very happy to
LikeLike
Hi John,
just trying to access the TicToc game without success. Is the link correct?
Thanks in advance
Giuseppe
LikeLike
Hi, it looks like the server is no longer active, sorry
LikeLike